
How Statistics Are Used in Sports Betting: The Data-Driven Edge
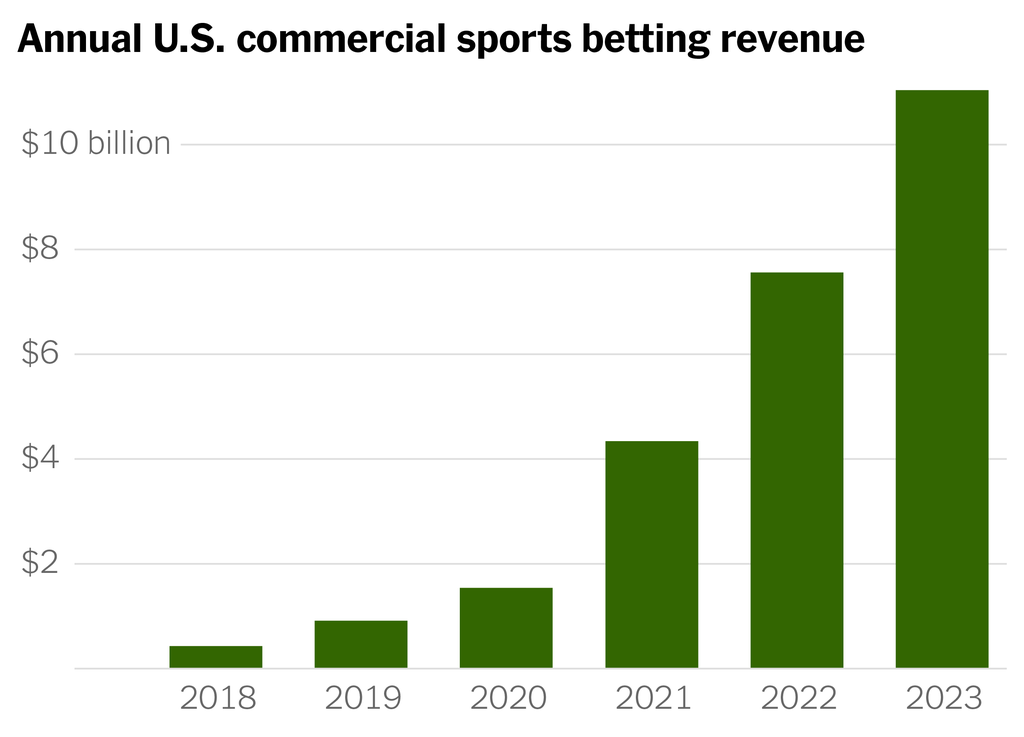
In the modern era, sports betting has evolved from a pastime based on gut feelings and team loyalty into a sophisticated, data-centric industry. The proliferation of high-speed internet, advanced analytics software, and vast databases has transformed how bookmakers set odds and how bettors approach wagering. At the core of this transformation lies statistics. Understanding how statistics are used in sports betting is no longer just an advantage; it is a prerequisite for anyone looking to engage with the market seriously. From predictive modeling to identifying market inefficiencies, statistics serve as the backbone of every informed betting decision.
The Role of Statistics in Setting Betting Lines
Bookmakers are not gamblers in the traditional sense; they are risk managers. Their primary goal is to set betting lines that attract equal action on both sides while ensuring a profit margin, known as the vigorish or “vig.” To achieve this, they rely heavily on statistical models. These models process historical data, player performance metrics, weather conditions, and even psychological factors to calculate the probability of a given outcome.
For example, in the NBA, a bookmaker’s model might analyze:
- Offensive and defensive efficiency ratings per 100 possessions.
- Pace of play to estimate total points.
- Player usage rates and injury reports.
- Rest days and travel schedules.
These variables are fed into algorithms that output a “true” probability. The bookmaker then adjusts this probability to create a line that encourages balanced betting. If the statistics suggest a team has a 60% chance of winning, the moneyline odds will be set slightly lower than the fair value to guarantee a house edge. Thus, statistics are the foundation upon which every odds screen is built.
Predictive Analytics and Machine Learning
The most advanced sportsbooks and professional bettors have moved beyond basic descriptive statistics into the realm of predictive analytics. Machine learning models, such as random forests, gradient boosting, and neural networks, are trained on decades of game data to identify patterns that human analysts might miss.
Key Statistical Techniques in Betting Models
These methods allow bettors to find “value” — situations where the bookmaker’s odds imply a lower probability than the bettor’s model calculates. Consistently exploiting such statistical discrepancies is how professionals achieve long-term profitability.
Public Statistics vs. Proprietary Data
Not all statistics are created equal. The average bettor has access to public data: box scores, advanced metrics from sites like Basketball Reference or Football Outsiders, and injury reports. However, professional syndicates and sharp bettors often invest in proprietary data sources. These include:
- Player tracking data (e.g., Second Spectrum in the NBA, RFID chips in the NFL).
- Biometric data (heart rate, fatigue levels).
- Real-time weather and field condition sensors.
- Social media sentiment analysis.
The edge lies in processing this data faster and more accurately than the market. When a bookmaker lags in adjusting odds to new statistical information, sharp bettors pounce.
Common Statistical Metrics in Sports Betting
Different sports rely on different statistical families. The table below outlines key metrics by sport and their betting application.
| NBA | Net Rating (Offensive – Defensive) | Predicting point spreads and moneylines |
| NFL | DVOA (Defense-adjusted Value Over Average) | Evaluating team efficiency beyond yards |
| MLB | FIP (Fielding Independent Pitching) | Assessing pitcher performance for totals and sides |
| Soccer | xG (Expected Goals) | Identifying over/under value and team form |
| Tennis | Break Point Conversion Rate | Predicting match winners and set betting |
Understanding these metrics is essential, but the true skill lies in knowing which ones are predictive versus descriptive. For example, a team’s win-loss record is descriptive; its Pythagorean expectation (based on points scored and allowed) is far more predictive of future performance.
Line Movement and Market Efficiency
Statistics also drive the analysis of line movement. When a betting line shifts — say, from -3 to -4.5 — it signals that new information or heavy money has entered the market. Statistical bettors monitor these movements to infer what sharps might know. If a line moves against public betting percentages, it often indicates that professional statistical models have identified value on the opposite side.
Market efficiency is the idea that all available information is already priced into the odds. However, statistical analysis is the tool used to test that efficiency. In less popular leagues or niche markets (e.g., player props, first-half lines), inefficiencies are more common because bookmakers devote fewer resources to perfecting their models.
The Pitfalls of Misusing Statistics
While statistics are powerful, they are not infallible. Common mistakes include:
- Overfitting: Creating a model that fits historical data perfectly but fails on new data. This is rampant among amateur bettors who backtest excessively.
- Ignoring Sample Size: Drawing conclusions from a small number of games. A player going 5-for-5 in a week does not mean they have a 100% success rate.
- Survivorship Bias: Only analyzing successful bets while ignoring losses, leading to a distorted view of a model’s true performance.
- Correlation vs. Causation: Assuming that because two variables move together, one causes the other. For instance, a team’s winning streak might correlate with a new uniform color, but that does not mean the color causes wins.
Professional bettors use rigorous statistical validation, including out-of-sample testing and cross-validation, to avoid these traps.
Conclusion: The Statistical Imperative
In the competitive world of sports betting, statistics are not just a tool — they are the language of the market. From the moment a bookmaker posts an opening line to the final whistle, every odds change, every proposition, and every sharp bet is underpinned by statistical reasoning. For the modern bettor, embracing statistical literacy is the only sustainable path to success. Whether you are building your own regression models, subscribing to advanced metrics, or simply understanding why a line moved, the numbers tell the story. Ignore them at your peril; master them, and you gain a genuine edge in an increasingly efficient marketplace.