
How Sports Betting Odds Work: A Technical Guide to Pricing, Probability, and Market Efficiency
Sports betting odds are far more than the numbers displayed next to a team name. They are the output of sophisticated pricing models, the language of risk, and the mechanism by which operators balance their books. For anyone working in sports tech, fintech, or data analytics, understanding how odds function is essential—not because you intend to place a wager, but because odds represent one of the purest real-time applications of probability, market dynamics, and incentive design in modern software.
This guide breaks down the anatomy of sports betting odds, the mathematics behind them, and the market forces that shape their movement.
The Core Concept: Odds as Implied Probability
At their foundation, odds express the likelihood of an outcome as determined by the market. Every price you see implies a probability. Converting odds into implied probability is the first skill any serious analyst—or engineer building a pricing engine—must master.
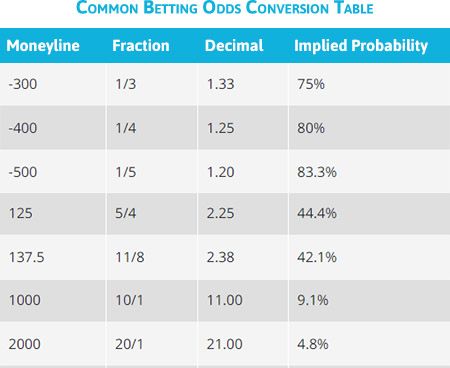
The two dominant formats are American odds (favored in the United States) and decimal odds (standard in Europe, Australia, and Canada). Each format encodes the same information but presents it differently.
American Odds
American odds use a plus or minus sign. A negative number indicates the favorite and shows how much you must stake to win $100. A positive number indicates the underdog and shows how much you win on a $100 stake.
- Favorite example: -150 means you risk $150 to profit $100.
- Underdog example: +200 means a $100 stake returns $200 in profit.
Decimal Odds
Decimal odds represent the total return per unit staked, including the original stake. A price of 2.50 means a $1 stake returns $2.50, of which $1.50 is profit.
Converting Odds to Implied Probability
Implied probability is the market’s estimate of how likely an outcome is, expressed as a percentage. The formulas differ by format.
| Negative American | -150 | |Odds| / (|Odds| + 100) | 60.0% |
| Positive American | +200 | 100 / (Odds + 100) | 33.3% |
| Decimal | 2.50 | 1 / Decimal Odds | 40.0% |
When you sum the implied probabilities of all possible outcomes in a market, the total exceeds 100%. That surplus is the operator’s edge.
The Vig: Where the House Builds Its Margin
The vigorish (or “vig,” also called the juice or margin) is the commission baked into the odds. It is the single most important concept for understanding why sportsbooks are profitable regardless of which side wins.
Consider a simple two-outcome market—say, a tennis match—priced at -110 on both sides. Converting each to implied probability yields approximately 52.4%. Add them together and you get 104.8%. The extra 4.8% is the book’s theoretical margin.
- Fair odds: Both sides priced at even money (+100 / 2.00), implying 50% each.
- With vig: Both sides priced at -110, implying 52.4% each.
- Operator margin: Roughly 4.8% of total handle, assuming balanced action.
This margin guarantees profitability over large sample sizes provided the book attracts roughly equal action on both sides. In practice, books rarely achieve perfect balance, which is where line movement comes in.
How Odds Move: Line Movement and Market Efficiency
Odds are not static. They shift in response to money flow, news, and the book’s own risk exposure. Understanding line movement is critical for anyone building or analyzing betting products.
Why Lines Move
Sharp vs. Soft Books
The market is segmented into sharp books (low-margin operators that welcome professional action and set efficient prices) and soft books (higher-margin operators that cater to recreational bettors). Sharp books are typically the first to move, and soft books follow. This lag creates arbitrage opportunities that sophisticated bettors and automated systems exploit.
Key Odds Types in Modern Sports Betting
Different markets encode probability differently and carry distinct margins.
| Moneyline | Pick the outright winner | 2%–5% |
| Point Spread | Winner adjusted by a handicap | 4%–5% |
| Totals (Over/Under) | Combined score vs. a set number | 4%–5% |
| Prop Bets | Player or event-specific outcomes | 6%–12% |
| Futures | Season-long or tournament outcomes | 15%–30% |
Prop bets and futures carry wider margins because they are harder to price and attract less liquidity, making them less efficient than mainstream markets.
Expected Value: The Analytical Lens
Serious analysts evaluate odds through expected value (EV), which measures whether a wager is profitable over the long run.
The formula is straightforward: EV = (Probability of Win × Profit) − (Probability of Loss × Stake).
A positive EV bet exists when the true probability of an outcome is higher than the implied probability of the offered odds. This is the fundamental insight behind every quantitative betting operation, and it translates directly to any domain involving probabilistic pricing—insurance, prediction markets, or ad auctions.
Why This Matters Beyond Betting
Sports betting odds are a real-time, high-liquidity prediction market. They aggregate information faster than almost any other public signal. For technologists, they illustrate how pricing algorithms, incentive design, and information asymmetry interact under extreme time pressure. Whether you are building a trading engine, a recommendation system, or a risk model, the mechanics of odds offer a masterclass in applied probability.
Understanding odds is not about gambling. It is about reading the market’s collective intelligence—and knowing precisely where that intelligence is priced in.